MENU

Introducing... Panjiva Dashboards

Critical insights on your home page

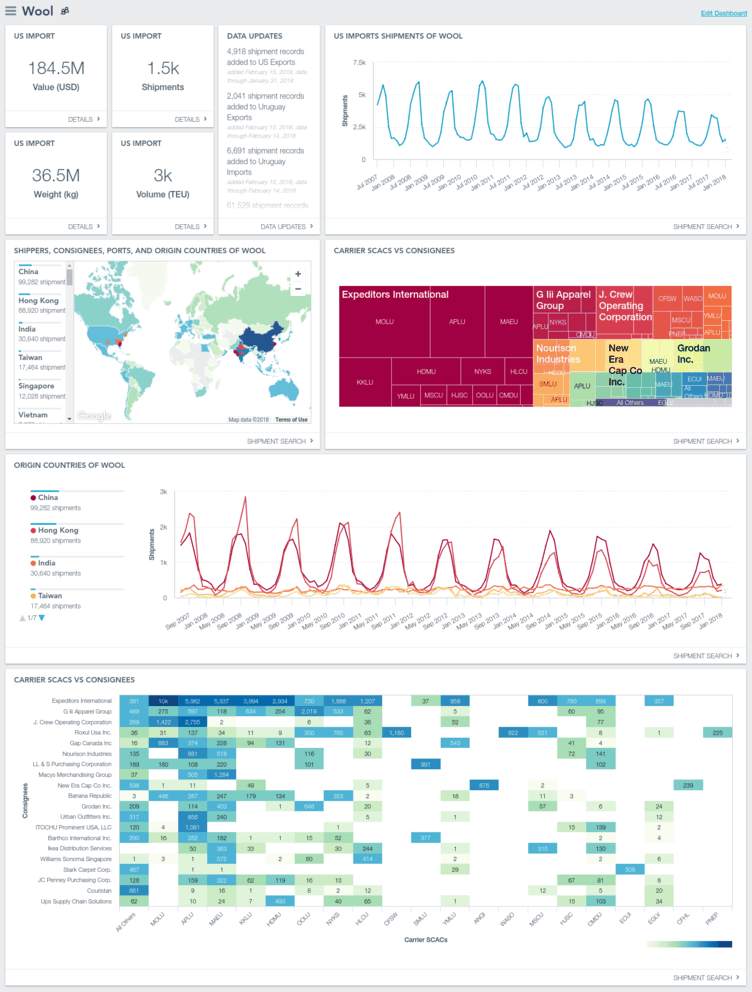
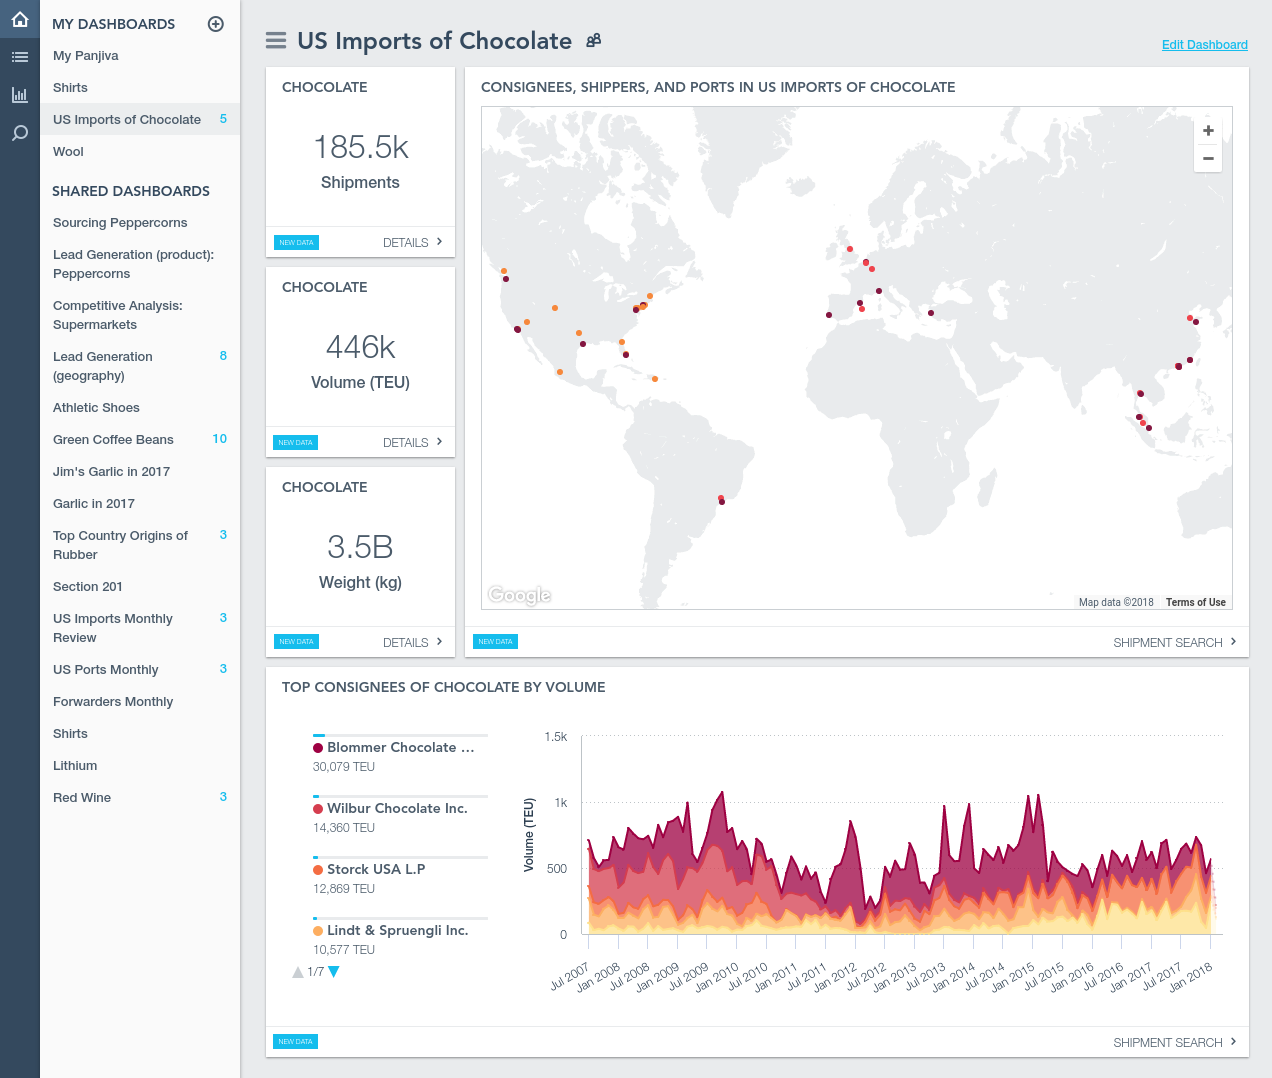
Create custom, elegant summary visuals for the most important supply chain metrics to your business, available as soon as you sign in.

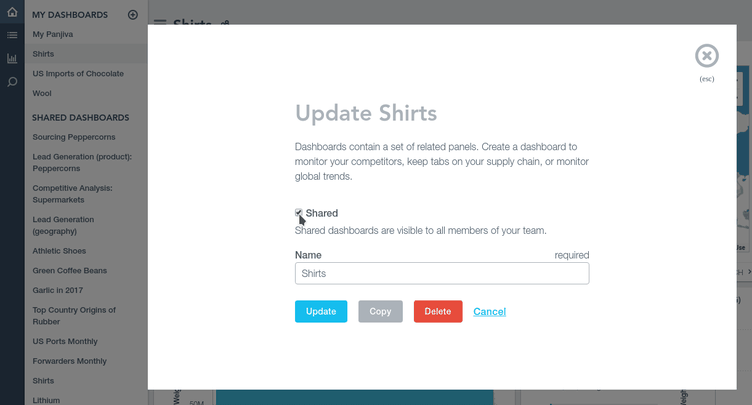
Quick to build, custom to you

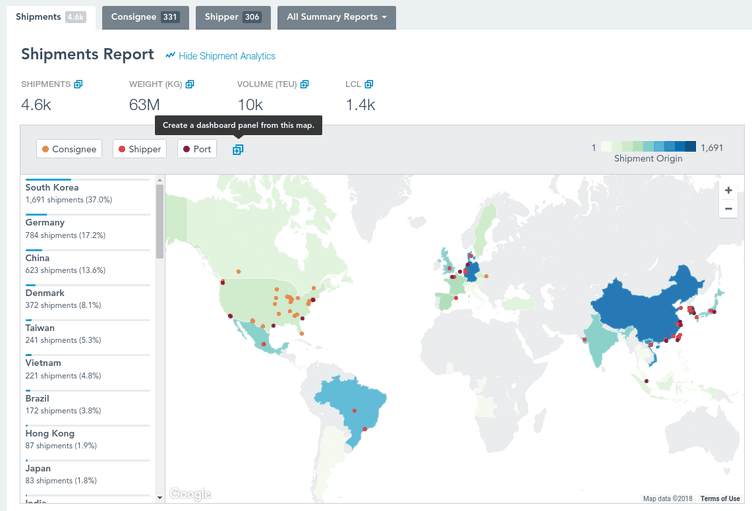
Add items like heat maps, top-line figures, and trend graphs to your dashboard with the click of a button.

Fresh every day

Automatic updates across all Panjiva data put the latest available insights right at your fingertips.

Found it? Add it.

Panjiva Dashboards were designed to save you time. Whether it’s a chart, a heat map, or a top-line number, adding Panjiva insights to your dashboard is just a click away. It’s never been this easy to organize your most valuable trade insights.


Add a visualization to a dashboard

Request a demo

Share key insights

Once you’ve created your own dashboard, it’s easy to share it with other members of your team. Just click to share and they will be able to view your shared dashboards in addition to their own.


Share a dashboard

Request a demo

Stay on top of the latest data

Your dashboards and panels will always alert you to new data. Stay up-to-date on your customers and your competitors with the all the latest information.


New data in dashboards

Request a demo