MENU

Global Trade Intelligence Platform

Actionable Insights & Information

Grow your market share, reduce costs in your supply chain, generate business intelligence, and save valuable time. Whatever your goals, our web-based platform is designed to provide solutions.

Get Started Today

Request Demo
Subscribe

Personalized Dashboards

With Panjiva Dashboards, automatic updates put the latest insights at your fingertips.
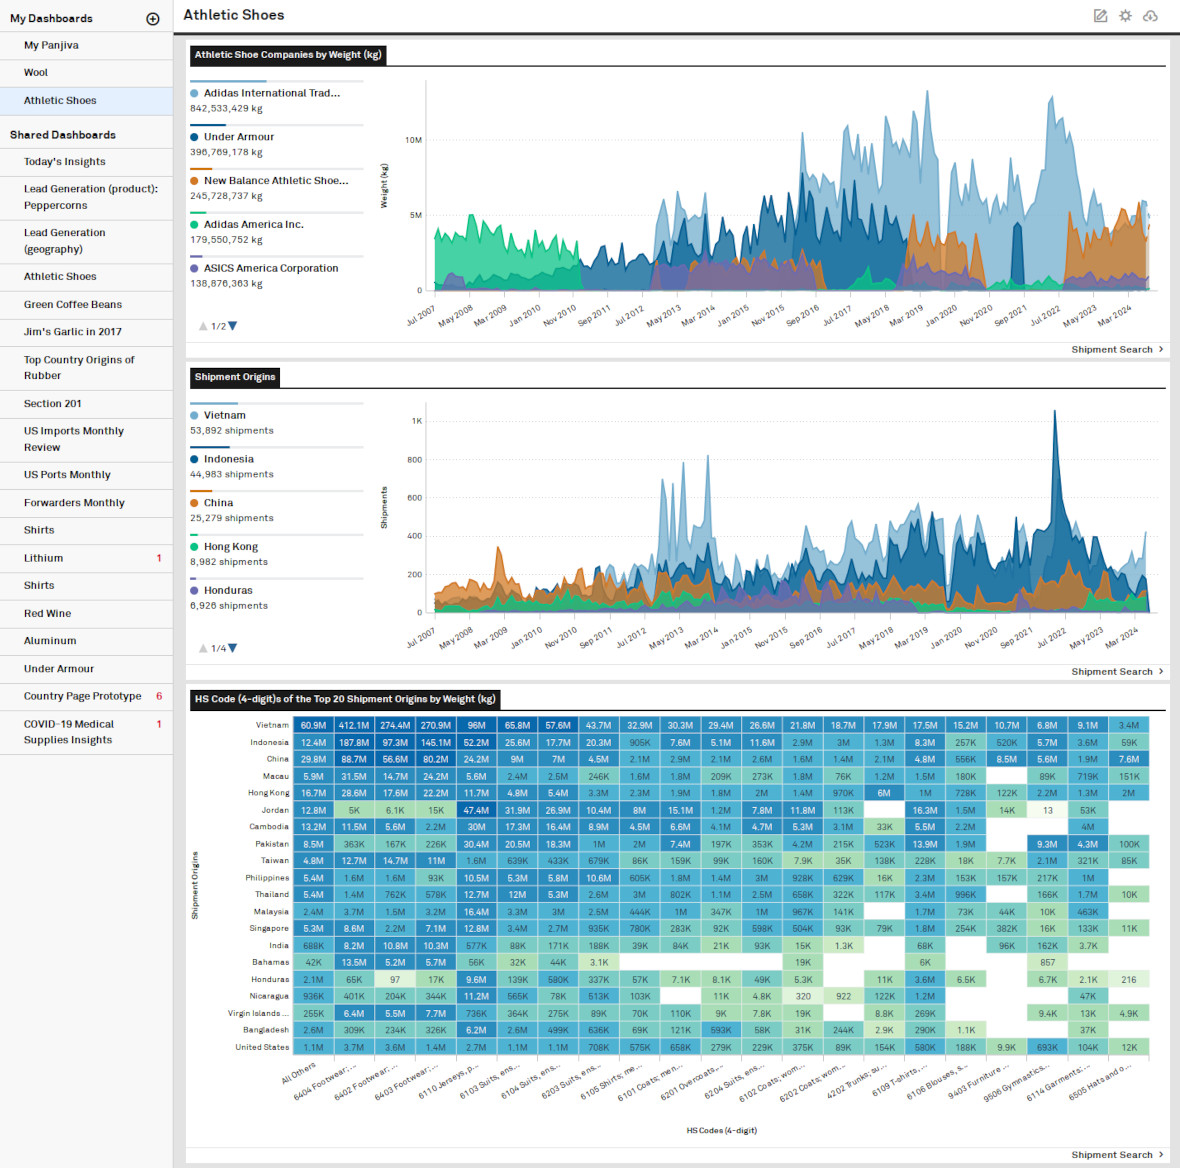
Personalized Dashboards

Request a demo

Analyze Trade Relationships

Investigate your customers’ and competitors’ trading partners.
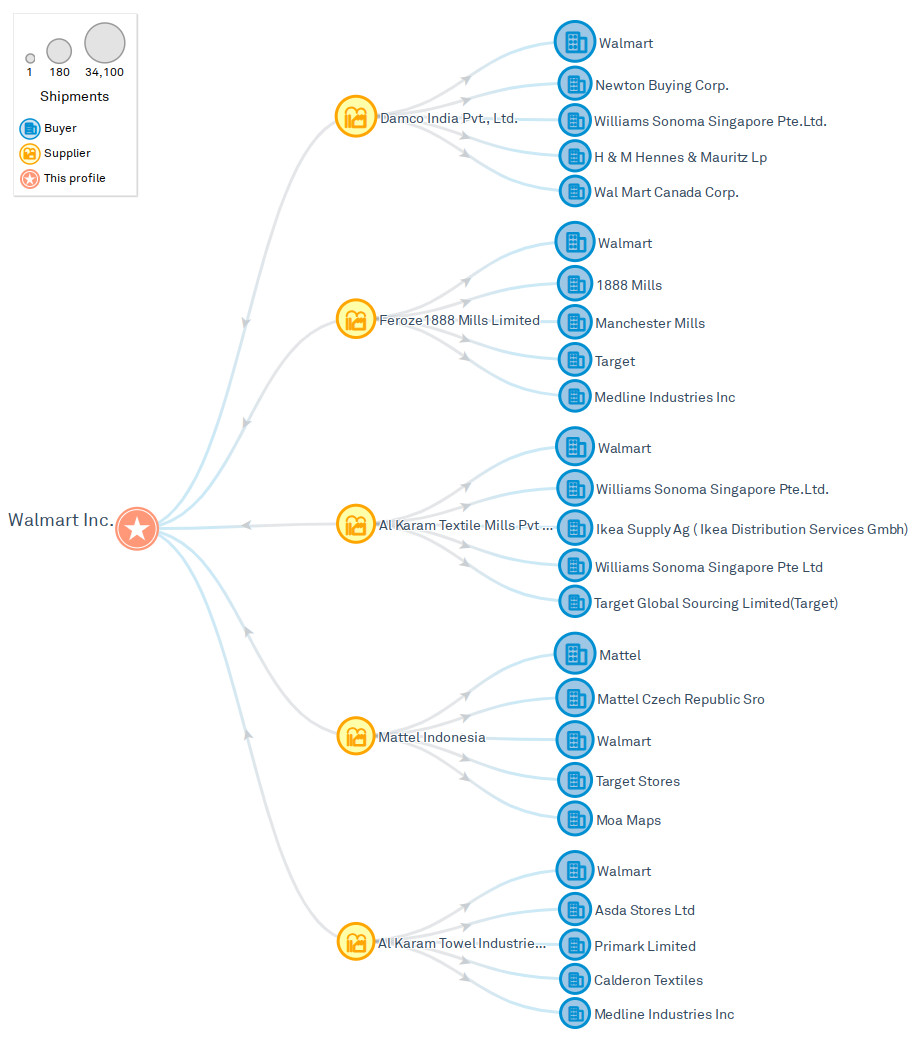
Network View Diagram

Request a demo

Determine Market Share

Understand your market share by carrier, port, country, or method of shipping.
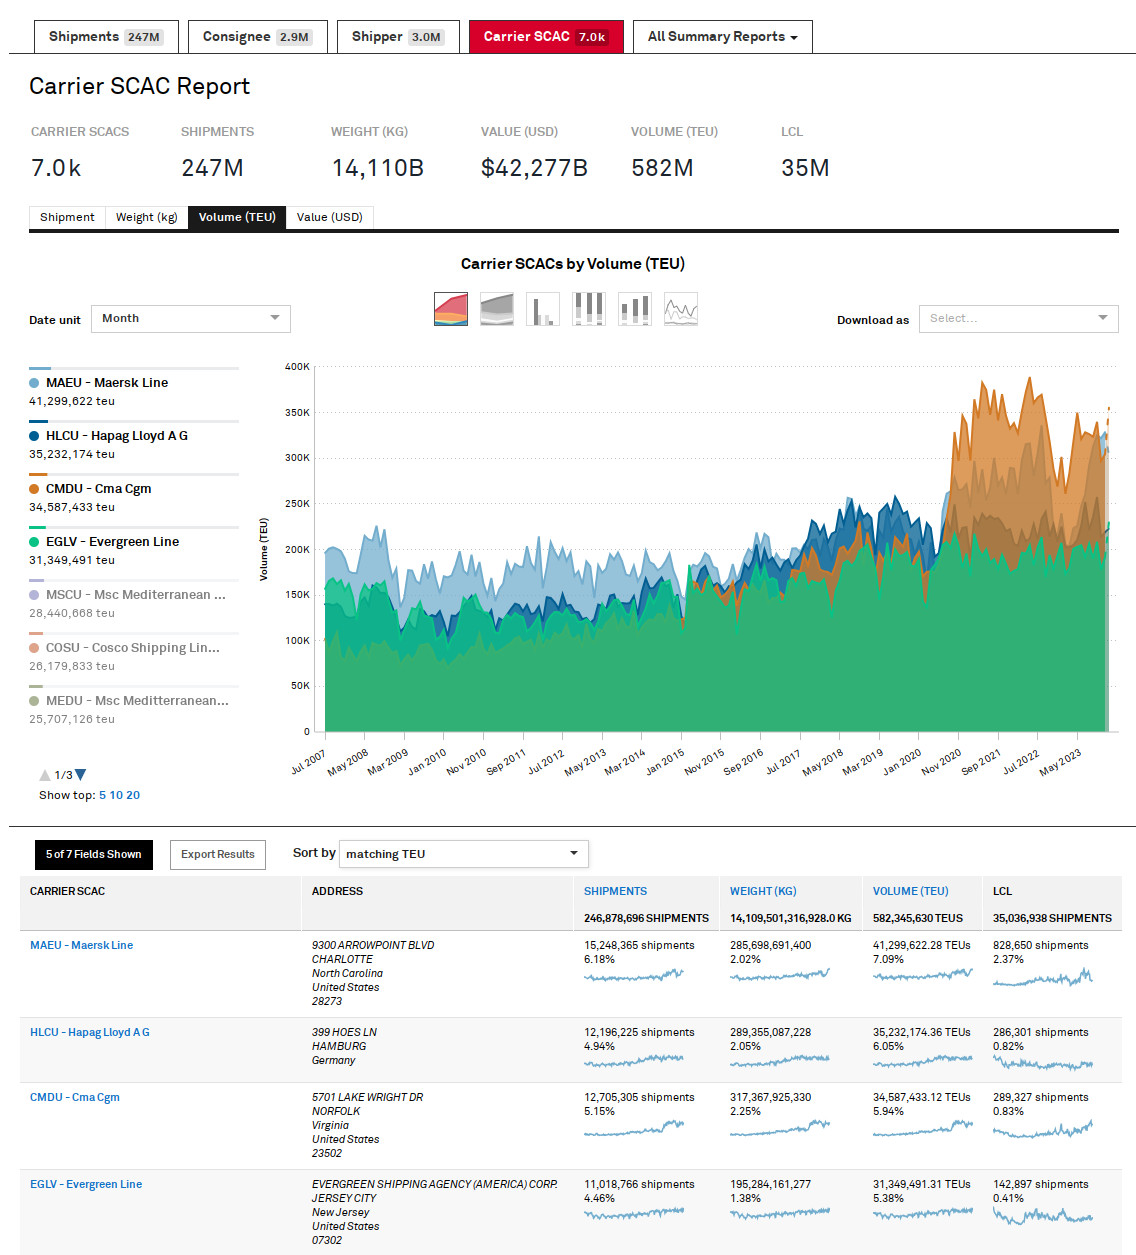
Summary Report

Request a demo

Source New Products

Find raw or finished goods locally or internationally.

Search by Location

Request a demo

Review Latest Trends

Use our analytics tool to discover trends in trade by product and company.
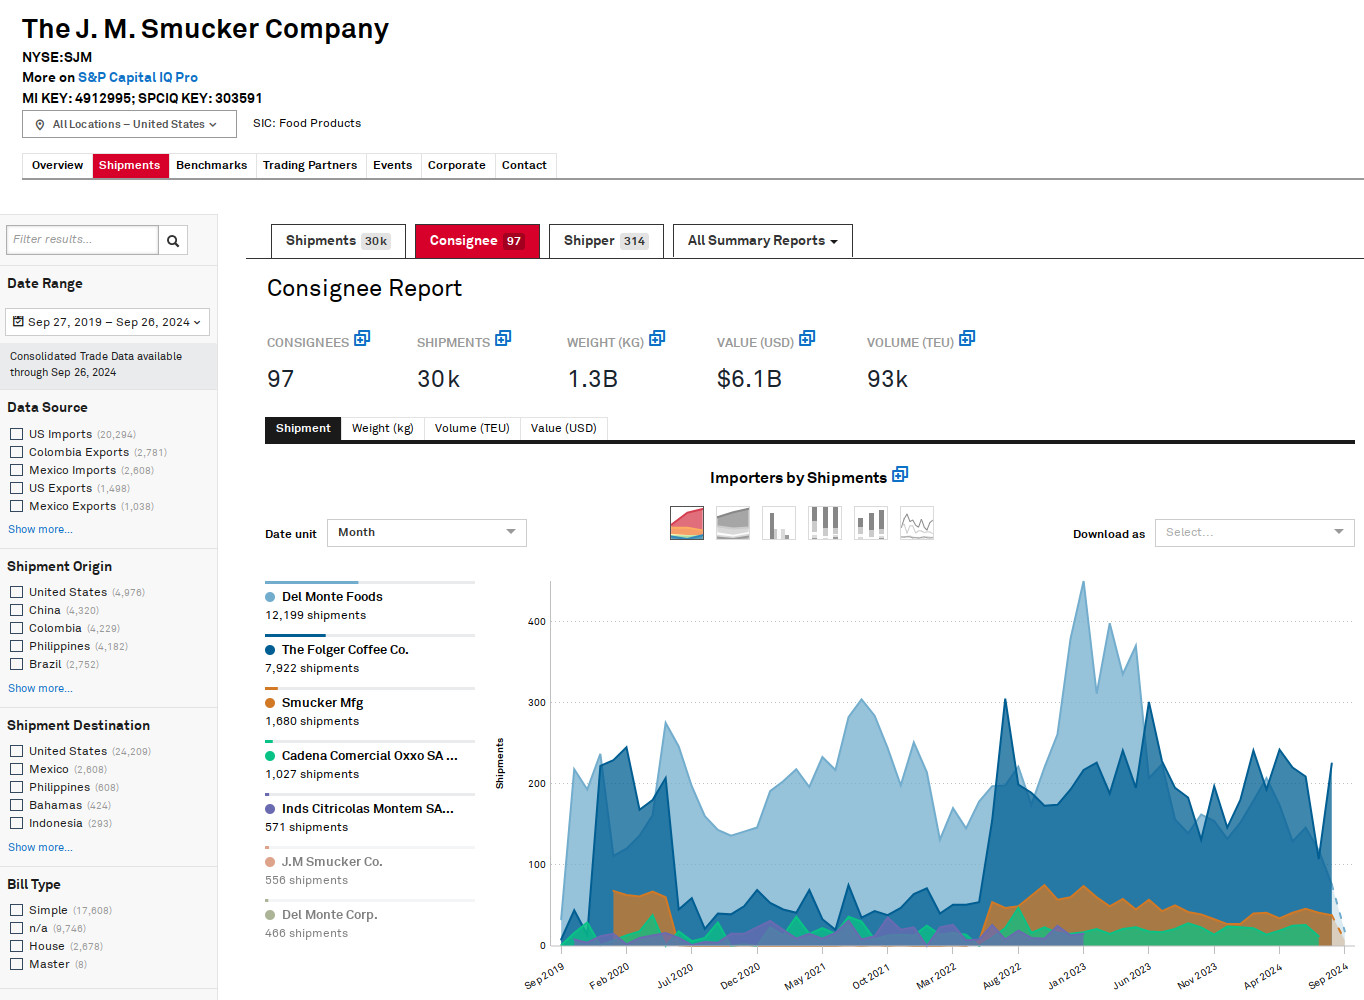
Company Profile Analytics

Request a demo

Mitigate Business Risks

Proactively investigate your prospective or existing business relationships.
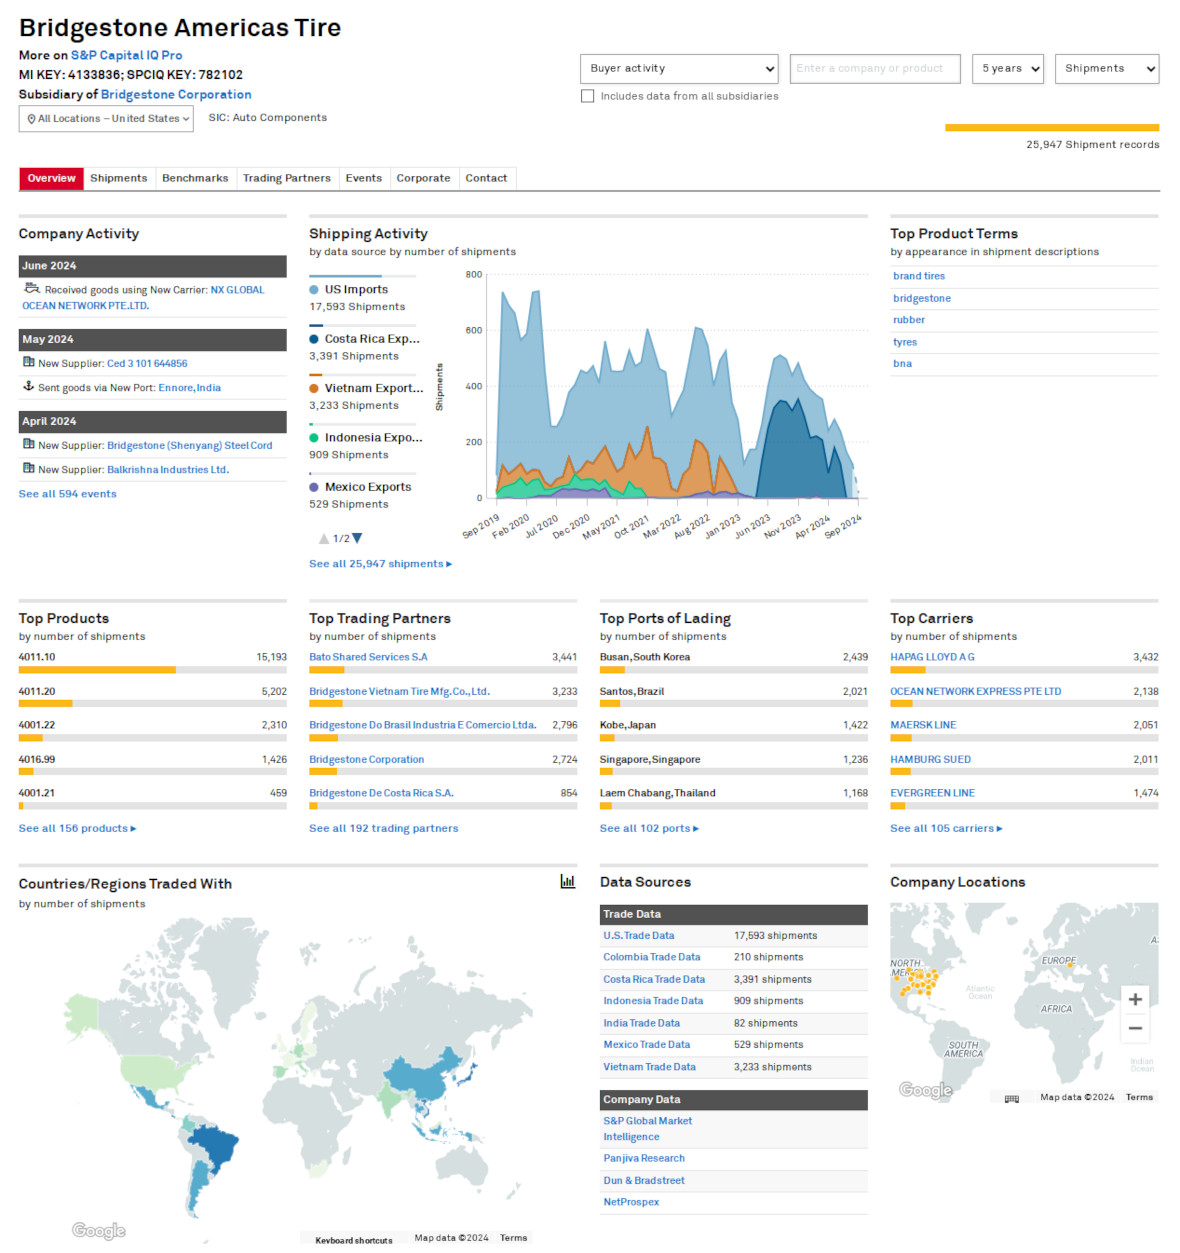
Company Profile Report

Stay Informed

Get email notifications when new shipments arrive/depart or when new businesses emerge.
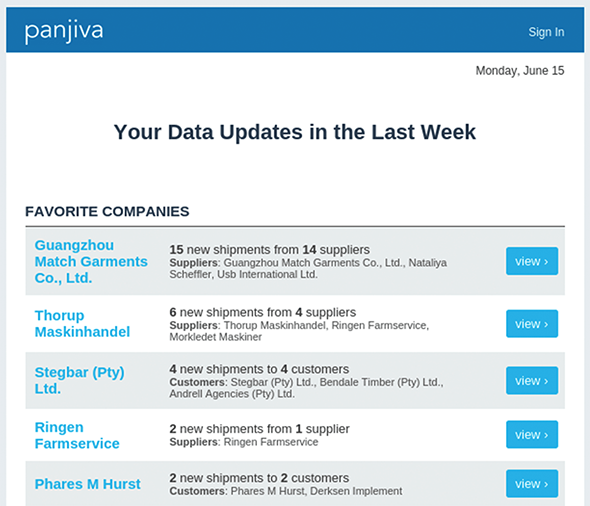
Email Alerts

Examine Raw Data

Access and examine Bill of Lading records (a.k.a. ship manifests).
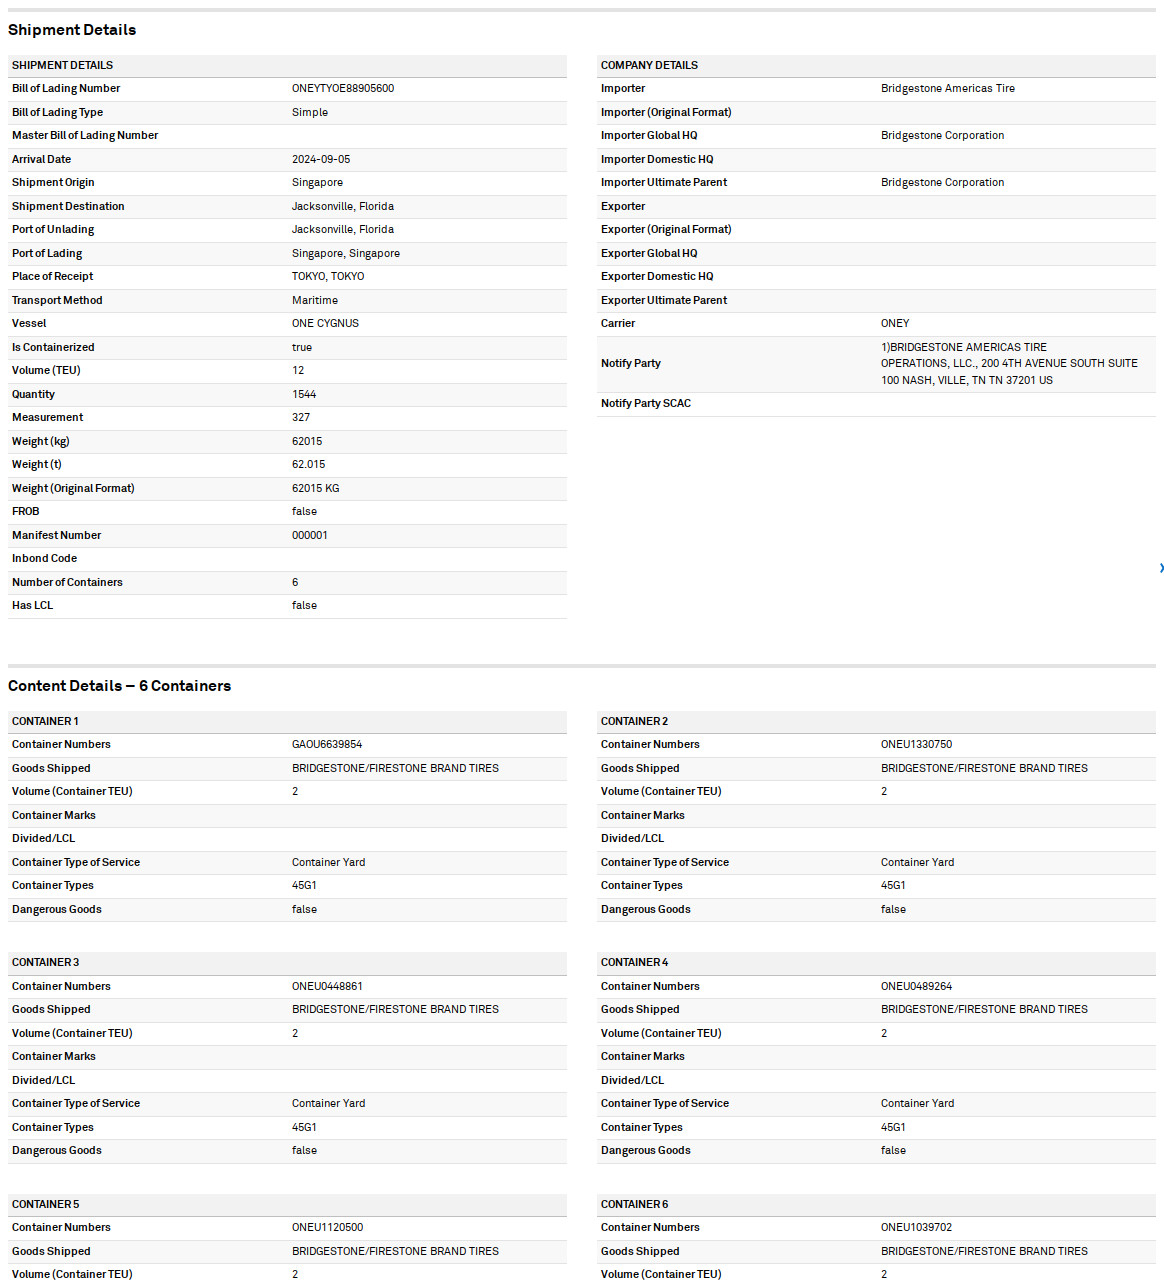
Bill of Lading Record

Designed to answer questions

At Panjiva, we are focused on delivering the high-quality inputs that our clients need to make decisions. That's why we focus on providing trade data at the individual shipment level.

Shipment Data Company Data Location Data
  • Bill of Lading
    Commodity Description, Consignee, Shipper, …
  • Cargo Weight
    Kilograms & metric tons
  • Container Info
    Type, TEU, LCL, Value (USD)…
  • Product Classifications
    HS, HTS, SIC, …
  • Company Info
    Revenue, employee count, locations, …
  • Contact Info
    Name, title, phone, & email
  • Corporate Family
    Parent company, subsidiaries, affiliates, …
  • Country Data
    Country of Origin and Destination
  • Port Data
    Port of Lading & Unlading
  • Regional Data
    Province, State, & Zip
Shipment Data
  • Bill of Lading
    Commodity Description, Consignee, Shipper, …
  • Cargo Weight
    Kilograms & metric tons
  • Container Info
    Type, TEU, LCL, Value (USD)…
  • Product Classifications
    HS, HTS, SIC, …
  • Company Data
  • Company Info
    Revenue, employee count, locations, …
  • Contact Info
    Name, title, phone, & email
  • Corporate Family
    Parent company, subsidiaries, affiliates, …
  • Location Data
  • Country Data
    Country of Origin and Destination
  • Port Data
    Port of Lading & Unlading
  • Regional Data
    Province, State, & Zip
  • Credible Data Sources

    Panjiva gives you access to over 1 billion shipment records and 8 million companies, from trustworthy sources in:

    United States Brazil Central & South America India Vietnam China

    * All Panjiva subscriptions come with United States Trade Data (Imports & Exports), with the opportunity to upgrade and access other sources.

    Why Panjiva

    Panjiva supply chain intelligence, a product offering from S&P Global Market Intelligence, knows technology. We build sophisticated, proprietary machine learning algorithms to transform messy shipment records into clean, useful data. When you search our data, we want you to find exactly what you’re looking for without wasting valuable time. Here’s how our algorithms can add value to your business:

    Unique Company Profiles Data Standardization Common Product Categories

    Trade data is messy. Our technology can take different representations of a single entity, such as a company or a location, and eliminate duplicates to present a clean and trustworthy profile.

    We know that standardized data is vital for comparison. We normalize units of measurement such as shipment weight, correct erroneous values in original sources, and impute missing elements like TEU values and port locations.

    We classify trade data into the Harmonized Tariff System (HTS), the international standard for numeric product classification. Our proprietary smart classification technology allows us to fill in missing HS Codes at the 6 digit level, or greater. Common categories enable search and analysis across data sets and languages.

    Unique Company Profiles
    Trade data is messy. Our technology can take different representations of a single entity, such as a company or a location, and eliminate duplicates to present a clean and trustworthy profile.
    Data Standardization
    We know that standardized data is vital for comparison. We normalize units of measurement such as shipment weight, correct erroneous values in original sources, and impute missing elements like TEU values and port locations.
    Common Product Categories
    We classify trade data into the Harmonized Tariff System (HTS), the international standard for numeric product classification. Our proprietary smart classification technology allows us to fill in missing HS Codes at the 6 digit level, or greater. Common categories enable search and analysis across data sets and languages.